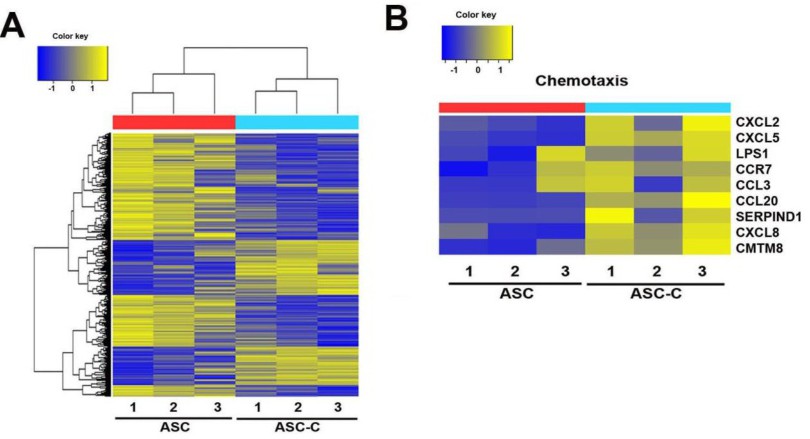
Fig. 2. Cell proliferation and global gene expression patterns of ASC-C and ASCs. Untreated ASCs were used as controls. (A) Global gene expression profiles of three lines of ASCs and ASC-C. The results of hierarchical clustering analysis represented as a heat map where each row reflects a probe set. Yellow signifies increased expression, and blue signifies decreased expression. (B) Heat map of chemotaxis as a biological process. (C) Chemotaxis as a significantly regulated process in ASC-C compared with ASCs.